The self-employment puzzle: continued ...
Pursuing our puzzling over who are the newly self-employed since the recession, here is a picture of overall change in self-employment between the final quarter of 2013 and the same quarter five years previously at the end of 2008. It’s a bit more revealing than Benedict’s picture of percentage change, and Morgan Stanley’ partial reporting of numbers (see links to left, or at bottom if browsing on mobile), as it shows the numbers involved for all of the main occupational groups they used, distinguishes people of working age from those over 65, and separates the former into full- and part-time employment.
Figure #1
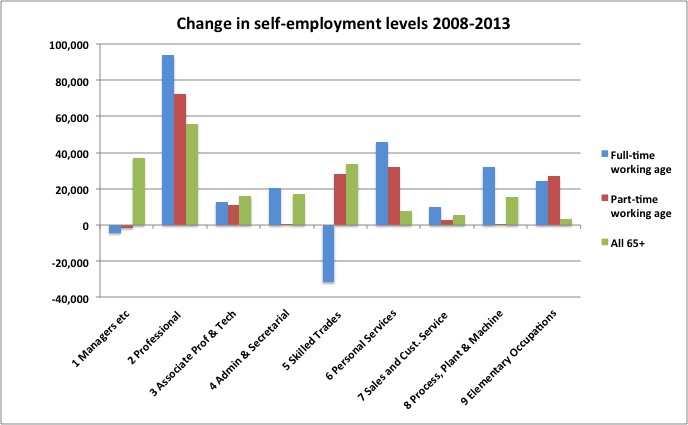
An interesting point revealed by this is that change among the over-65s tends more to the higher-level occupational groups and, in comparison, change among those of working age tends more to the lower-level groups.
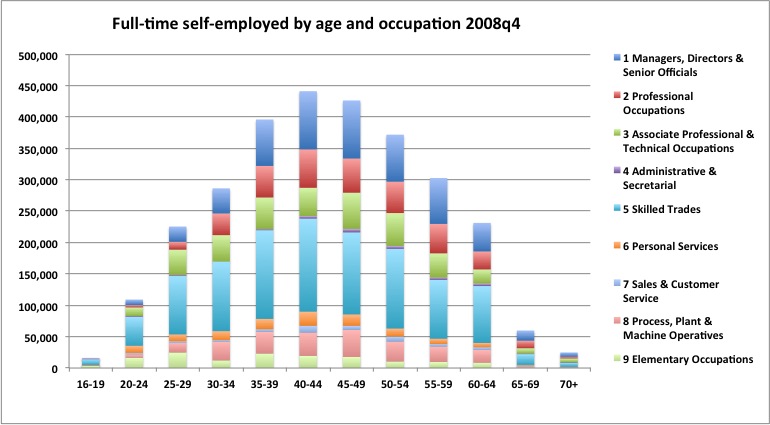
Looking at levels of full-time self-employment in different occupations in 2008 by age bands, clear patterns are visible. But there is little variation in the proportions of different occupations across age bands with the exception of an unsurprising bulge in the two ‘highest’ groups between 35 and 59, and a falling off in numbers in elementary occupations beyond 35-39.
Figure #2
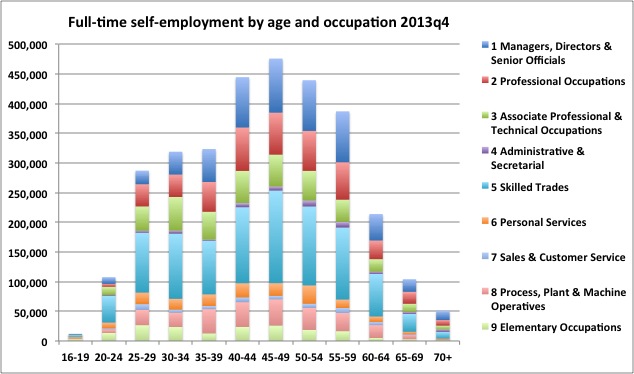
Similar patterns can be seen five years later in 2013, but on a chart to the same scale with clear rises across the board except in the 35-39 and 60-64 bands it can be seen how the rise in levels among the working-age has been pushed up by increases from the bottom, and in ‘Professionals’.
Figure #3
The picture for part-time self-employed was quite different from full-timers, in terms of the distribution both within and across age-bands, with notably lower proportions of higher occupational groups up to the age of 45, a population of ‘Admin and secretarial’ workers who barely appear among full-timers, and more of a trend of increasing numbers with age.
Figure #4
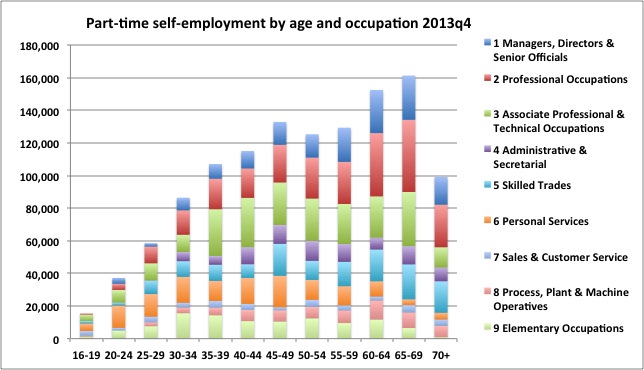
Looking at the position in 2013 on a chart to the same scale, numbers are again higher across the board, but the trend of increasing levels with age is much more marked.
Figure #5
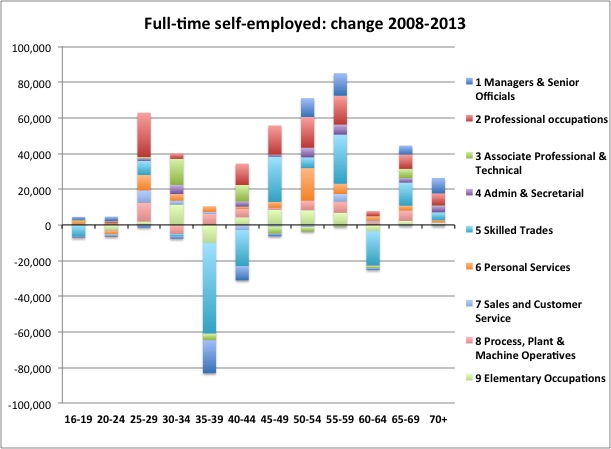
Looking closely just at the change in levels and comparing full-timers and part-timers on charts to the same scale to see the components of change. This is essentially a disaggregation by occupation of the analysis carried out by the ONS that led to their conclusion that the growth in self-employment was driven by the old. It is a jumbly picture with little obvious trend: there are big variations within and across age bands. And some of these seem rather unlikely. For example that skilled trades should increase in the 55-59 and 65-69 bands, but diminish for 60-64 year olds. Or that there are now fewer Associate Professional and Technical people among 35-39 year olds than in 2008 but more among 30 to 34 year olds and 40-44 year olds.
Figure #6
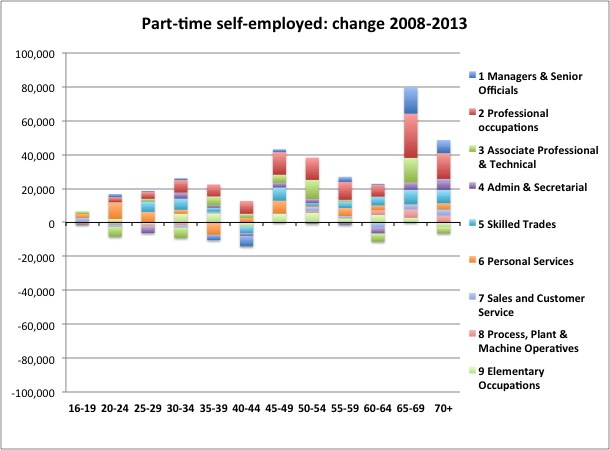
The picture for changes in numbers of people in part-time self-employment is similar but on a smaller scale.
Figure #7
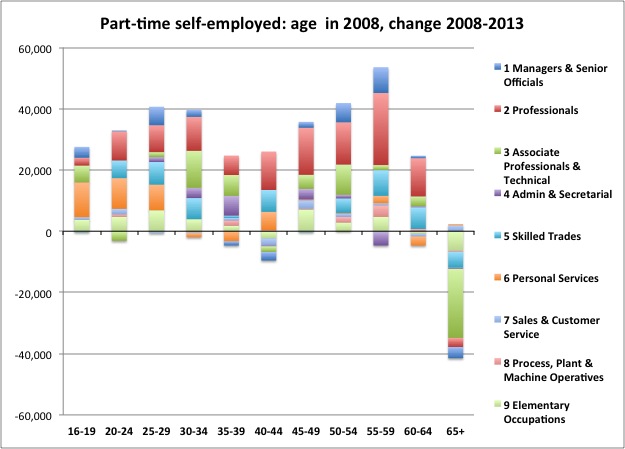
However if, as last week, we shift the age bands a different picture emerges with much clearer trends apparent. As the title indicates, these illustrate change that has occurred between 2008 and 2013 within each group e.g. comparing self-employment by occupation for those who were 25-29 in 2008 with self-employment by occupation for 30-34 year olds in 2013, as that is the group they are now in, five years on.
The very high numbers for 16-19 year olds and 20-24 year olds will result from first-time entry into work over the five years, as people leave school and university, so are not indicative of any meaningful change. This is consistent with Figures 6 and 7 showing little difference in overall levels at these age bands.
The columns for the other age bands, representing people who will already have finished their education in 2008, should give a fairly reliable indicator of the extent to which different occupational groups have contributed to changes in self-employment levels from 2008 to 2013. These suggest that for both full-time and part-time self-employment, while the largest single increase is among ‘Professionals’, the majority of new self-employment - certainly among those of working age – is in the lower and less skilled occupational groups. It is also notable in a context of overall increases in self-employment, that there is a actually a reduction in the numbers of full-time ‘Skilled trades’ that is only partly balanced by increasing numbers of part-timers in this occupational group.
Figure #8
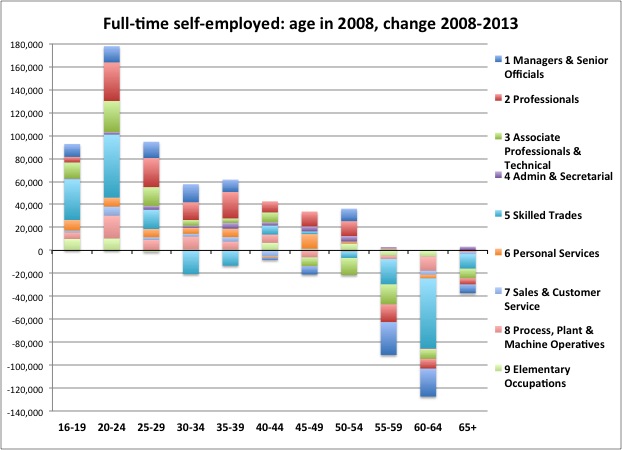
Figure #9
So now we have a better idea of what kind of jobs the newly self-employed are doing, what else do we know about them?
(to be further continued ….)
All data used is sourced from the UK Quarterly Labour Force Survey.
Some other puzzlers ...
Morgan Stanley
There are five key drivers of increases in UK self-employment. Overall these suggest the growth derives from weakness in the economy and is a sign of slack. Their report should download here.
Steven Toft (@FlipChartRick)
Increased self-employment doesn't appear to be necessarily a good thing, looked at internationally and macro-economically here
Benedict Dellot from the RSA
Growing self-employment results from opportunity not necessity, and suggestions to the contrary are myths to be busted here
Adam Lent from the RSA
High self-employment rates aren't a sign of economic weakness, but stirring entrepreneurial spirit here
TUC
The growth of self-employment is part of a trend towards casualised work, likely to hold back wages, and prevent people from having the kind of secure employment they need to pay their bills, save money and plan for the future here