If the (benefit) cap fits ...
“Today’s figures show that if we had not introduced the cap, more than 2,000 households would each have received over £10,000 a year more in benefits than the average taxpayer earns.
By capping benefits we are putting a stop to these runaway benefit claims and returning fairness to the system.”
Iain Duncan Smith, Secretary of State for Work and Pensions, 7 August 2014 in the latest DWP announcement on the benefit cap here
The benefit cap limits the amount of benefits households can receive to the amount ‘earned by the average taxpayer’. This is set at £500 a week (or £26,000 annually) for couples whether they have children or not, and lone parents, and £350 a week for single adults. I’ll say something about that another time.
The cap works by withdrawing weekly housing benefit by whatever amount is needed to reduce total benefit income to an annualised £26,000. So anyone capped by more than £200 a week will have been receiving benefits at a rate that would have amounted to at least £10,000 more than the defined ‘average taxpayer’ earnings over a year.
The latest figures are for the number of claims capped by the end of May 2014 and show that since the introduction of the cap, a total of 2,232 households have been capped by over £200 a week. But have they been “prevented from receiving over £10,000 a year more in benefits than the average taxpayer earns”?
The question has a simple answer – no.
At the most superficial level and obvious level that’s because only a very small number of the households being reported on had been capped for a year. The table shows how many claims have been newly capped each month, the total claims capped at that time, and the cumulative total of capped claims. The falls in the total capped at point in time since October 2013 show that each month more households are having their cap removed than are newly capped. So not only can very few (if any) households have been capped at this level for a year, but it is clearly not justified to assume that each cap of over £200 a week will last for a year, as at least half of these households capped during the last year have had their cap removed.
Figure #1
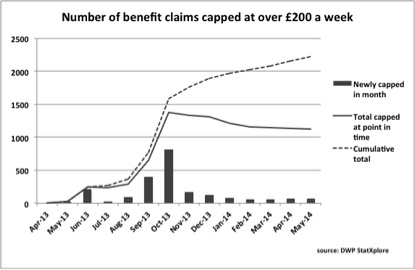
In fact only 28 households had been capped by over £200 a week by the end of May 2013. If all of these households were still capped by at least that amount at the end of May 2014, then it might be true to say that if the government had not introduced the cap, these 28 households would each have received over £10,000 a year more in benefits than the average taxpayer earns. Everyone else has been capped for less than a year.
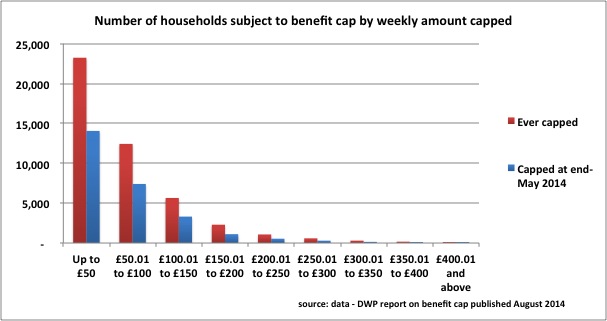
Of course payment of £10,000 a year more than the average taxpayer earns could be prevented over a shorter time for a household with a larger amount capped than £200 a week. But the numbers capped at higher levels tail off dramatically as the amount capped rises. Hmmm …. You can hardly see how many have been capped at £200 a week or more.
Figure #2
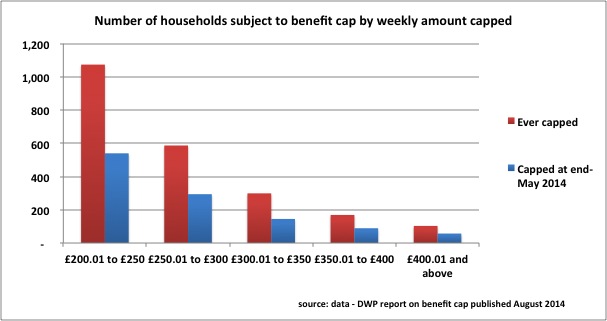
Zooming in to focus on the £200+ a week households, it’s plain that the numbers become very small indeed. In fact only 103 households claiming £400 or more have been capped at all and of those, nearly half aren’t capped now. But being generous there might be fifty households among these who have been capped for the six months necessary to have stopped them receiving £10,000 in benefit that they would otherwise have got in the absence of the cap. Lower amounts require longer periods, and the maximum period most caps can have lasted for is not even nine months, over which time to prevent £10,000 in benefit a claim of over £300 a week would be required. But there have only been 468 claims capped between £300 a week and £400 a week, and half of these are no longer capped. Being as generous as possible, there could conceivably be say 250 claims where the cap has prevented £10,000 being claimed.
That makes 300 households close to the maximum possible number that would each have received over £10,000 a year more in benefits than the average taxpayer earns, had it not been for the cap. Not quite ‘over 2,000’.
Figure #3
Now a spokesperson might say that’s unfair because I’m only counting households who will not have had £10,000 benefit paid to them while capped and that I’m ignoring the savings when people leave capping. Up to a point that’s true. If a household has the cap removed because someone reduces their claim below the level of the cap or stops claiming altogether, you might say that the imposition of the cap made them do so, so you can count in these households too.
The helpful data available through the DWP Stat-Xplore site allows you to see the reason for removal of cap by capped amount. The picture below shades the columns where there must actually have been a reduction in benefit claim to below capping levels – down to what the ‘average taxpayer earns’.
But in the clear majority of cases, removal of the cap has occurred simply because someone has entered low-paid work (if it were not low paid they wouldn’t be getting Working Tax Credit). This means that the total benefit claim is no longer restricted to ‘average taxpayer’ earnings and may return as high as its previous level.
Figure #4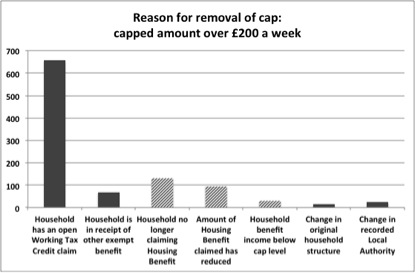
Add the definitely reduced or withdrawn claims and assume that almost all of them were prompted by the cap, and that could take the grand total for £10,000 savings to around 500 households.
So what Iain Duncan Smith should have said is that over 2,000 households who were claiming have had their housing benefit claims reduced by over £200 a week for at least a month. The figures may show that since the introduction of the cap, a total of 2,232 households have been capped by £200 a week or more, but this does not mean that they have each been prevented from receiving over £10,000 a year more in benefits than the average taxpayer earns. It means instead that for a period of at least a month their benefits were capped by at least £200 a week. Perhaps 500 households have been prevented from receiving over £10,000 a year more in benefits than the average taxpayer earns.
And as to the line about “putting a stop to these runaway benefits”, Stat-Xplore shows that the number of housing benefit claims of £200 a week or more has increased by nearly 6,000 since the cap was first introduced ...