Hutber's Law?
The Office of National Statistics (ONS) today provided a fine spread on “Families in the Labour Market 2014 ”.
This suggests that the @CCHQpress narrative of more people in work with the security of a pay packet supporting their families etc etc might apply with even more force to single parent households.
The percentage of lone parent families with dependent children that were classified as working families rose from 47.1% in 1996 to 65.5% in 2014. This is the largest increase of any family type and helps to explain the increase in the percentage of working families in general.
Well that sounds good and looks good too.
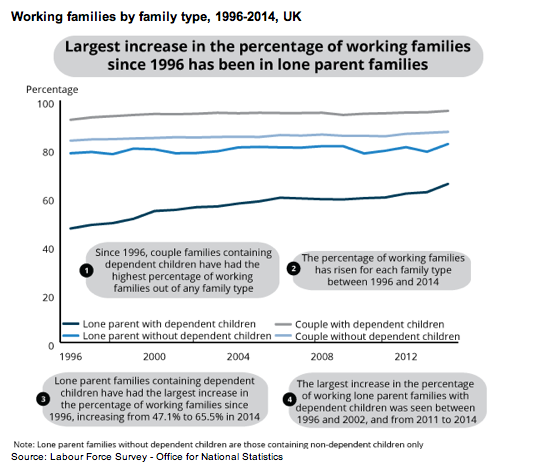
As to the reasons for this, the ONS says
The increase in the percentage of working lone parent families may be attributed to a combination of policy initiatives, changes in the characteristics of lone parents over time and general improvements in employment rates in the UK.
Pausing for a moment, it does seem a bit circular to attribute increases in employment rate of lone parents to general improvements in employment rate. That can’t really be cause and effect! And so far as policy initiatives go, the ONS highlights a stick rather than a carrot.
One of the policies which could have had an impact on the percentage of working lone parent families since 2008 is changes to the Lone Parent Obligation3. Prior to 2008, lone parents were eligible to claim Income Support provided that their youngest child was aged under 16. Between 2008 and 2012, the age criterion at which Income Support could be claimed was reduced incrementally down to children aged under five:
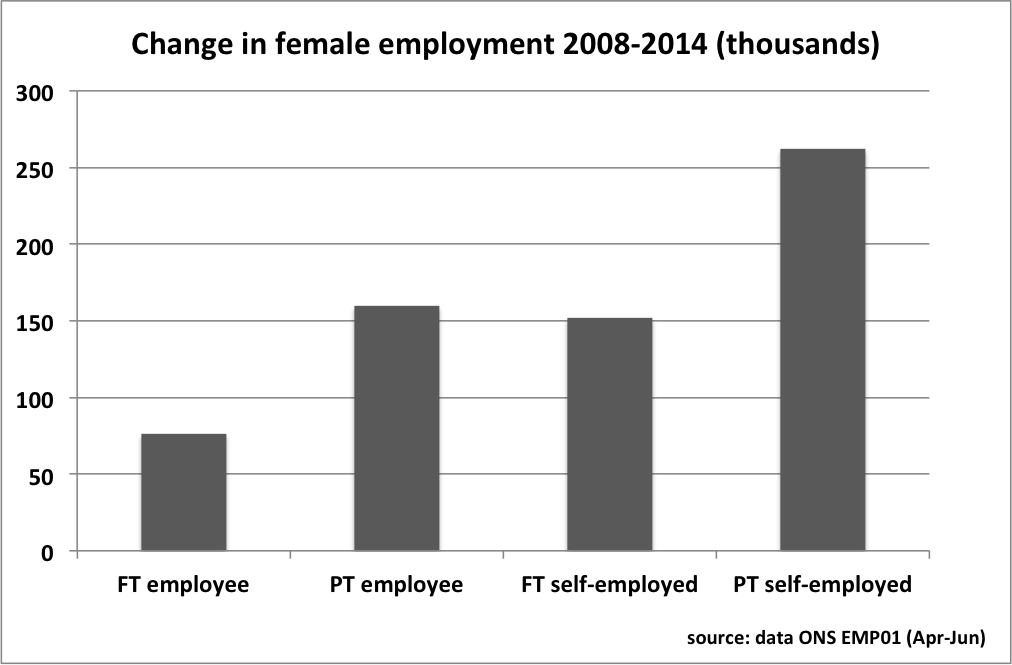
Perhaps not so good then. After all, as trailled very extensively elsewhere, increases in employment are not necessarily matched by improving prospects for individuals, with a very significant part of increasing employment being self-employment and/or part-time employment of really quite unknown economic benefit. Most lone parents are mothers, and this is the picture of change in overall female employment levels since 2008.
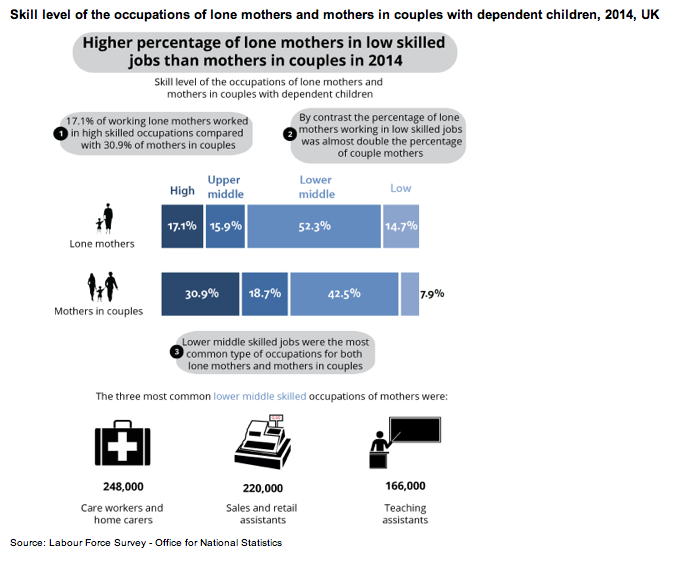
And looking at the occupations of single mothers specifically, the ONS graphic helpfully illustrates how single mothers are likely to be in lower-paid occupations. Still so far so good? At least they are in work and surely that’s for the best. Well as always, up to a point.
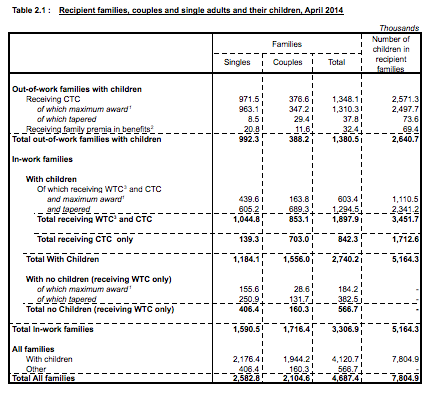
The data underpinning the ONS analysis is from the UK Labour Force Survey (LFS). I’m a great fan, but because the results are survey-based it’s always worth comparing and contrasting with ‘real’ information where this is available. So I’ve looked at HMRC data on tax credits that reports the actual numbers of families of different kinds actually claiming tax credits. Their annual snapshot of awards was taken in April 2014, conveniently matching the April-June 2014 period of the LFS used by the ONS.
From the outset there is a difference in the numbers of single-parent families with dependent children. The LFS has 1.97 million in total, HMRC have 2.18 million claiming tax credits. I’m not sure what the confidence interval for this LFS data is, but obviously the HMRC data is to be preferred as it is the actual number of claims being paid, rather than multiplied up from survey responses. But it should be clear from this that just about all single parents with dependent children must be claiming tax credits whether they are working or not.
Using the LFS data, the ONS reports that 720 thousand single parents with dependent children are not in employment. HMRC are paying out-of-work tax credits to at least 971 thousand. Some of this difference – and perhaps all of it – can be explained by the fact that out-of-work tax credits payments are made to people who are working less than 16 hours a week. But what this shows is that simply ‘being in employment’ isn’t at all an indicator of any kind of substantive or substantial income for single parents with dependent children.
Oddly, although ONS tabulate and illustrate the difference in part-time and full-time working between mothers with dependent children and without dependent children, they do not distinguish between mothers with dependent children who are single parents and mothers with dependent children in couples. That is clearly a key indicator of likely economic performance.
And more importantly ONS provide no comparative data at all on income. Now timely income data is hard to come by, all of the usual measures being based on samples or surveys and with a considerable lag in their publication. However, data from HMRC that I obtained from (another) Freedom of Information Act request revealed that in the previous year - 2012/13 - the mean income of single claimants in work was £9,410. Remember that this is for people working at least 16 hours a week. This could theoretically understate the income of single parents if the average is dragged down by single people without children, but this seems unlikely because – unconstrained by the need to look after children – the latter are more able to work full-time.
That things are unlikely to be much different in 2014 and that working single parents with dependent children have very low incomes is also inferable from the current published HMRC data that show 37% of single parents with dependent children claiming tax credits were receiving the maximum award, and only 11% earning enough for the Working Tax Credit element to be tapered away altogether. Bearing in mind from the numbers above that near enough every single parent with dependent children must be claiming tax credits this should be an accurate reflection of the incomes of all single parents with dependent children.
So on this data something like 90% of working single parents with dependent children and working 16 hours or more are still earning less than full-time minimum wage, and all reliant on tax credits.
In the context of suggestions that increasing numbers and proportions of working single parents are significantly contributing to ‘general improvement in employment rates’ I wonder whether this is another demonstration of Hutber’s law which for those not familiar with it proposes that improvement means ….. deterioration.
As I said in a previous post, income data at the most highly-aggregated level suggested that work is providing less and less for more and more, and it appears that this very different data at the most disaggregated level on income suggests much the same.
prompts and links ...
Jonathan Portes
Writing in Financial World, Jonathan puzzles over the lack of productivity rebound from recession, and wonders whether ground has been lost permanently here.
Morgan Stanley
There are five key drivers of increases in UK self-employment. Overall these suggest the growth derives from weakness in the economy and is a sign of slack. Their report should download here.
Steven Toft (@FlipChartRick)
Increased self-employment doesn't appear to be necessarily a good thing, looked at internationally and macro-economically here
Simon Wren-Lewis
"Why strong UK employment growth could be really bad news" on Mainly Macro here
Ben Chu
Still room for scepticism over this 'glorious recovery' in the Independent here
TUC
The growth of self-employment is part of a trend towards casualised work, likely to hold back wages, and prevent people from having the kind of secure employment they need to pay their bills, save money and plan for the future here