by email
Poor self-employed?
Back in July last year I wrote something here about what Labour Force Survey data on people receiving tax credits might tell us about self-employed incomes.
Since then I’ve got actual data on tax credits claimants and their incomes from HMRC under the Freedom of Information Act.
I’d been saving this up to put together with information on the earnings of self-employed people generally from the annual Personal Incomes statistics – which were released last week (30 January) but on reflection they don’t allow the right comparison so that is now waiting on another FOI request. Nonetheless, the data are interesting enough for the results to be worth sharing.
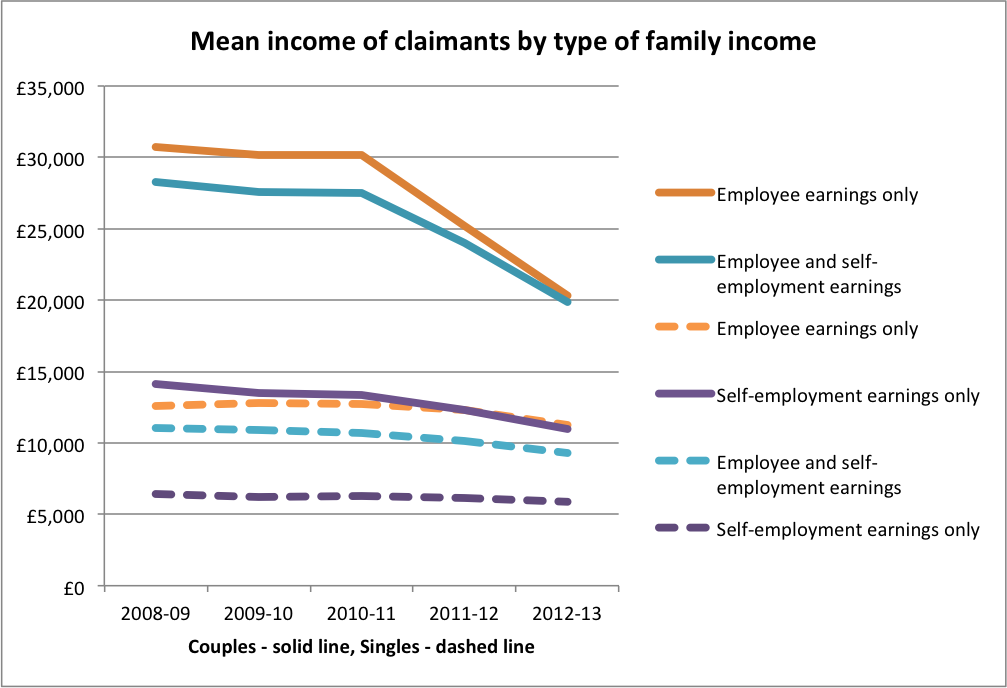
I asked HMRC for information on the incomes of families claiming tax credits over the past five years depending on whether they were singles or couples, and whether the family income derived from self-employment earnings only, employee earnings only, or both. This provides an interesting overall picture

The drop in mean income for couple claimants in entirely expected for the reasons I outlined in my July 2014 post – because payment of de minimis ‘family element only’ claims to families earning up to £50,000 was stopped. It is notable that this made a significant difference to claims by couples with only employee income and with both employee and self-employment income. It made much less difference to singles with only employee income and with both employee and self-employment income and to couples with only self-employment income. It made virtually no difference to singles with only self-employment income.
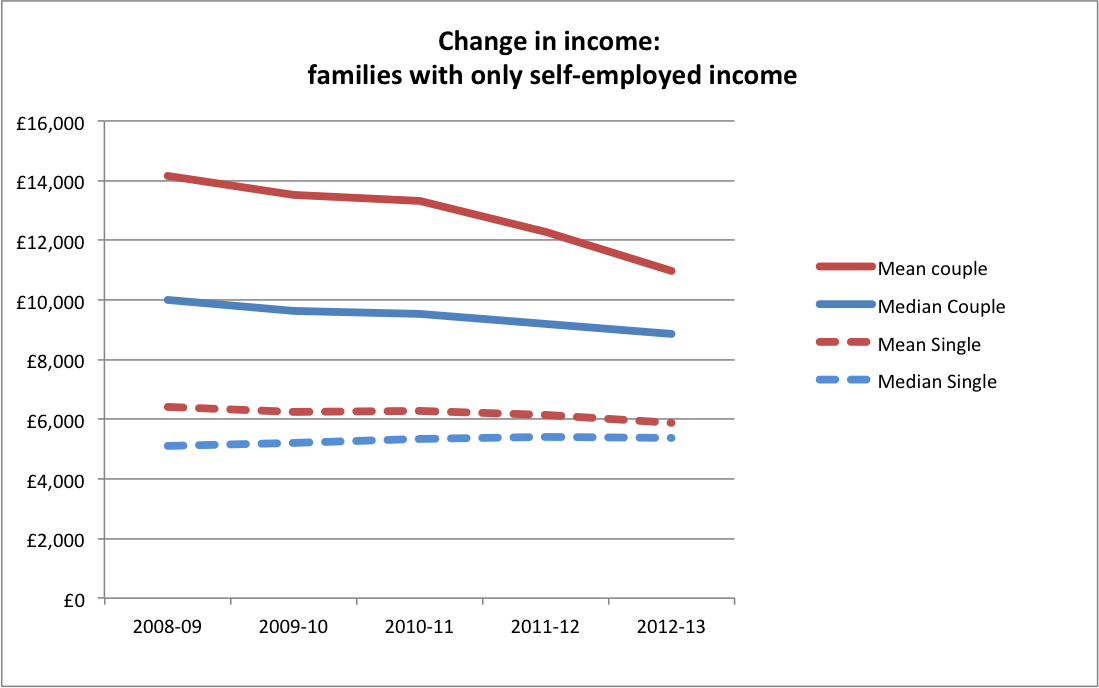
However, because of this change in eligibility and entitlement, any change in income levels cannot be directly observed. Though a further clue is provided by looking at how median and mean income changed differently. Looking just at those with self-employed income only gives the following picture for singles and couples. This shows that the median income for couples with only self-employment income was much lower than the mean but that the difference between the two has halved. Mean and median income for singles with only self-employment income have consistently been close and the gap between the two has closed slightly. The median level of income is for both groups low and is well below the equivalent of one earner on a full-time minimum wage.

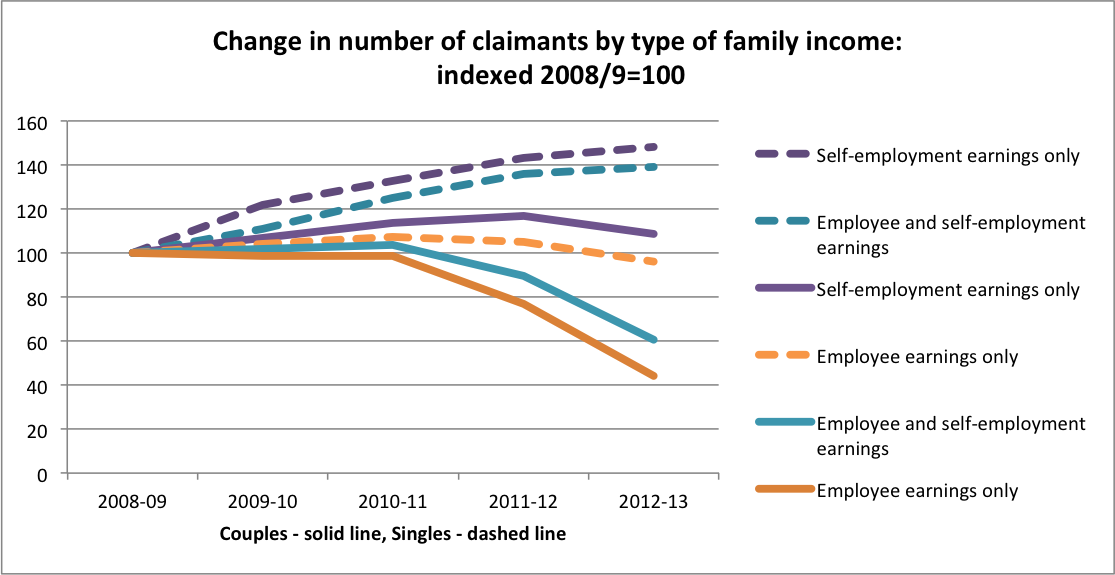
Remember that these figures apply only to people claiming tax credists and do not necessarily (or wholly) show that particular claimants have had sustained low incomes or that their income has dropped, but that this is how income levels for particular claimant groups have changed. Obviously some people might have increased their income and no longer be claiming tax credits at all. On the other hand others will have newly started claiming. Looking at how claimant numbers in each category have changed, it is notable that the number of single claimants with only self-employment income or with both self-employment and employee income has increased significantly while the number of single claimants with employee income only has slightly dropped. Whereas the number of couple claimants with any employee income has dropped significantly, the number of couple claimants with only self-employment income has risen.

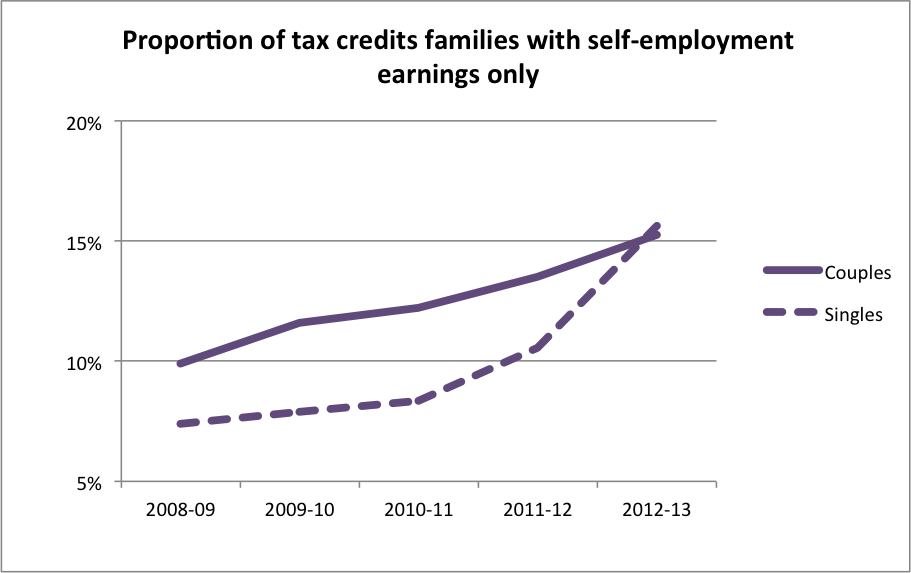
The result is that the proportion of tax credits claimants who are single people with only self-employment income has doubled, and who are couples with only self-employment income has increased by a half.

Overall these data provide another indicator of falling or faltering rewards to self-employment, certainly among the lower paid. They also suggest that employee income provides much more security at lower income levels than self-employment in line with my previous comments here on an interesting article by Benedict Dellot. And they also show (in particular by comparing the relative income of couple and single households) how it is not right to characterise individuals as in poverty merely because they have low levels of income themselves as I said yesterday here in response to comments by Richard Murphy.
Finally, these figures predate the 2013 ‘surge’ in self-employment, but their availability does suggest that when similar data for 2013/14 become available, they might well throw light on the extent to which this might or might not have been associated with the prospect of benefit capping.
_______
Update 2 February 2015: just to confirm that the HMRC figures separately identified out-of-work families, so average earnings should not be distorted by the inclusion of out-of-work families who earn nothing. Couple families with earnings can of course have only one partner working.
home
Contact
Some other puzzlers ...
Resolution Foundation
Original report on how the newly self-employed are likely to be suffer from some vulnerability and insecurity. But they don't appear to be much different in any key characteristic from the existing self-employed. Link to their report is here
Morgan Stanley
There are five key drivers of increases in UK self-employment. Overall these suggest the growth derives from weakness in the economy and is a sign of slack. Their report should download here.
Steven Toft (@FlipChartRick)
Earlier blog on increased self-employment doesn't appear to be necessarily a good thing, looked at internationally and macro-economically here
Benedict Dellot from the RSA
Growing self-employment results from opportunity not necessity, and suggestions to the contrary are myths to be busted here
Adam Lent from the RSA
High self-employment rates aren't a sign of economic weakness, but stirring entrepreneurial spirit here
TUC
The growth of self-employment is part of a trend towards casualised work, likely to hold back wages, and prevent people from having the kind of secure employment they need to pay their bills, save money and plan for the future here
Jonathan Portes
Writing in Financial World, Jonathan puzzles over the lack of productivity rebound from recession, and wonders whether ground has been lost permanently here.